 RawDog v1.0 RawDog v1.0
No-Code Tool for Raw Data Processing & Plotting
⬇ Downloads ▶ Watch Full DemoRawDog v1.0 is a no-code GUI for turning raw .txt and .csv data into clean plots. It's a fast, intuitive alternative to MATLAB and Python for signal analysis.
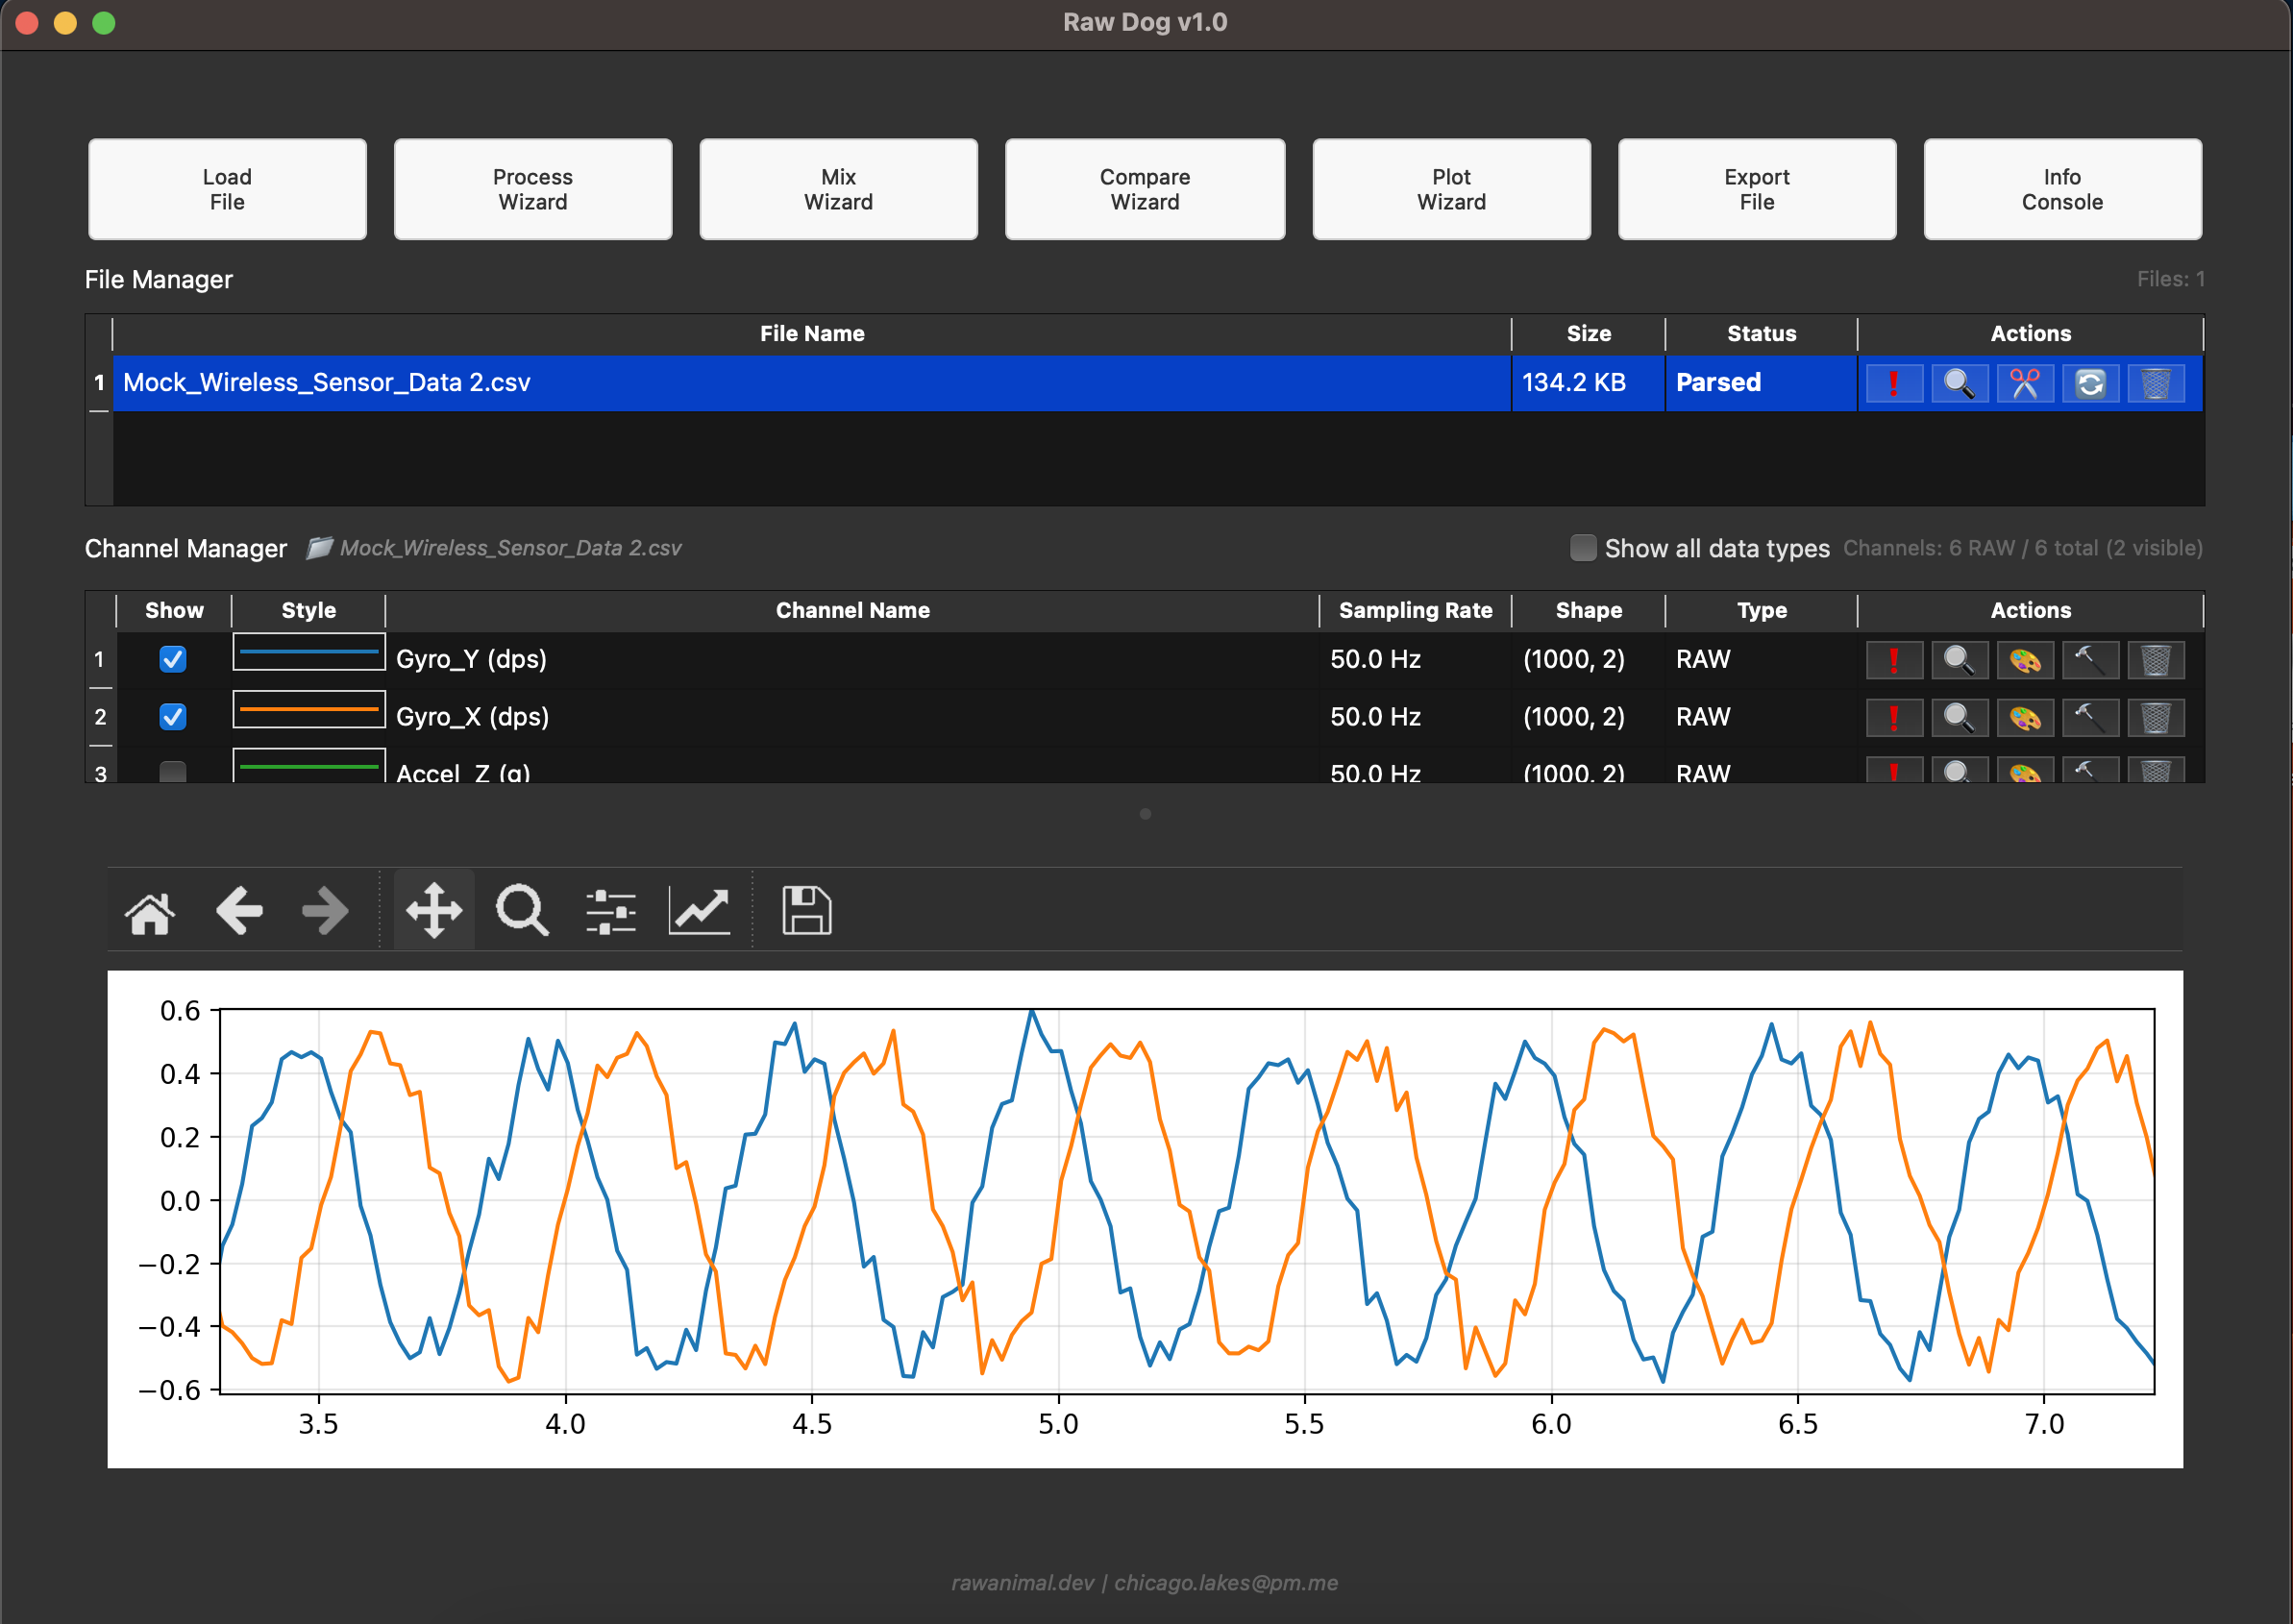
Main Interface: Load data, auto-parse, and visualize raw signals.
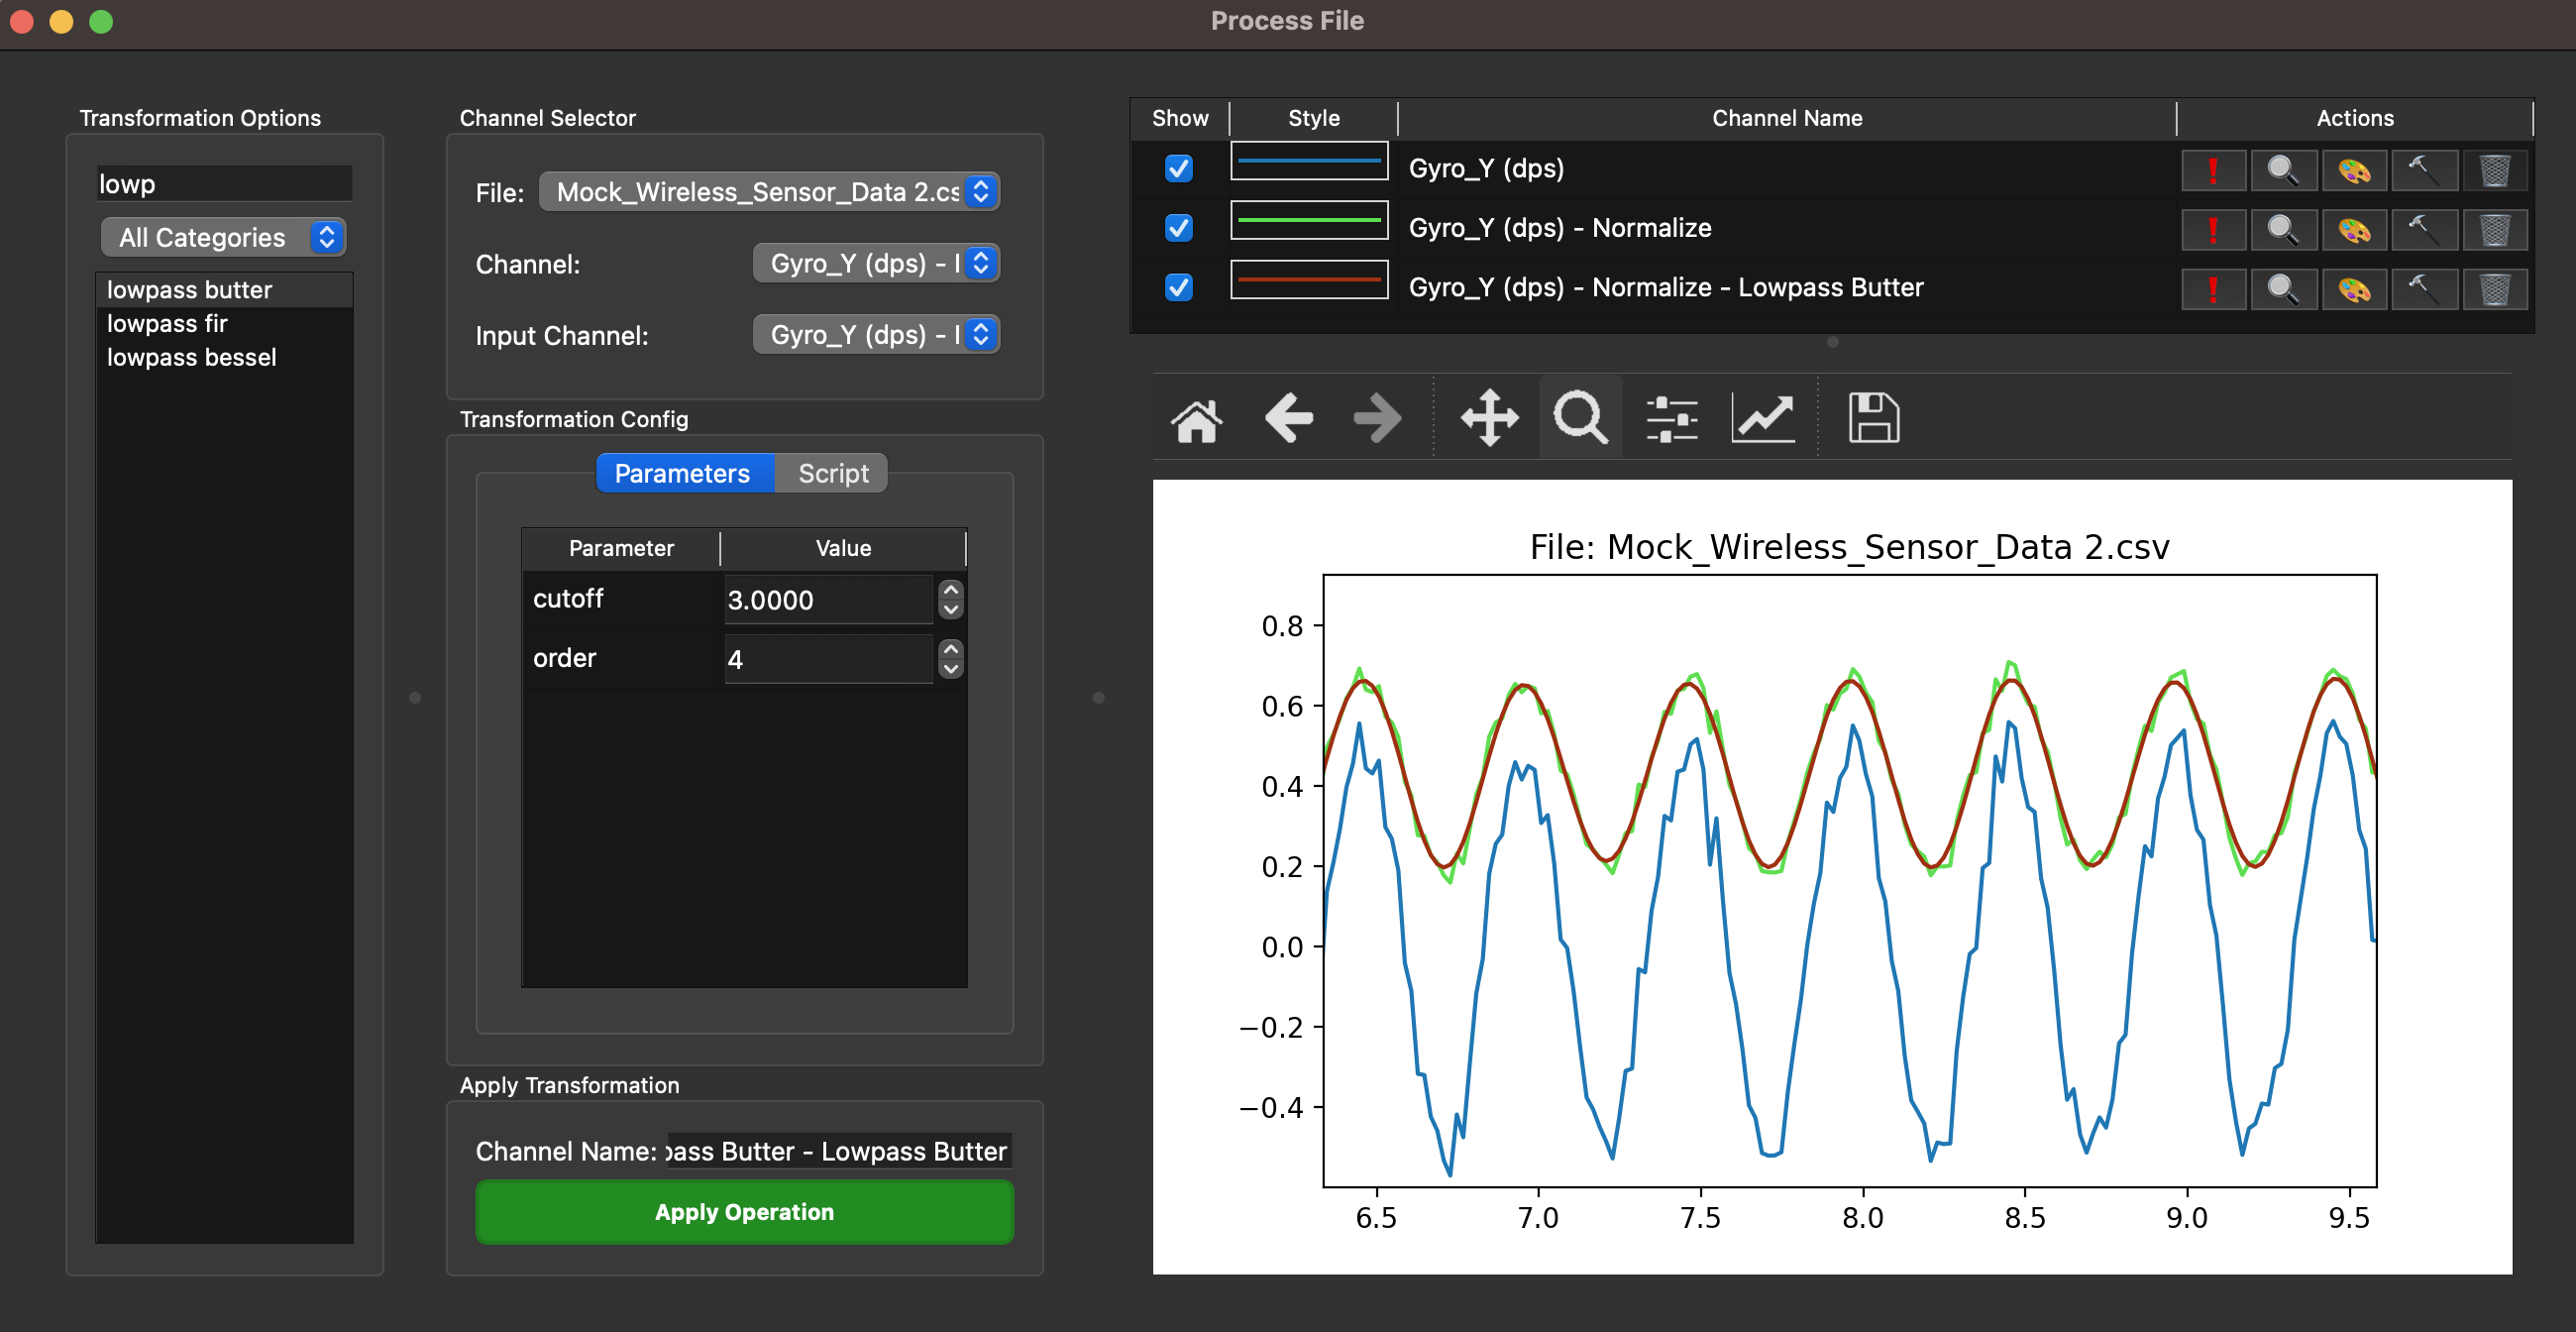
Process Wizard: Apply transformations like filtering, normalization, and resampling — no code needed.
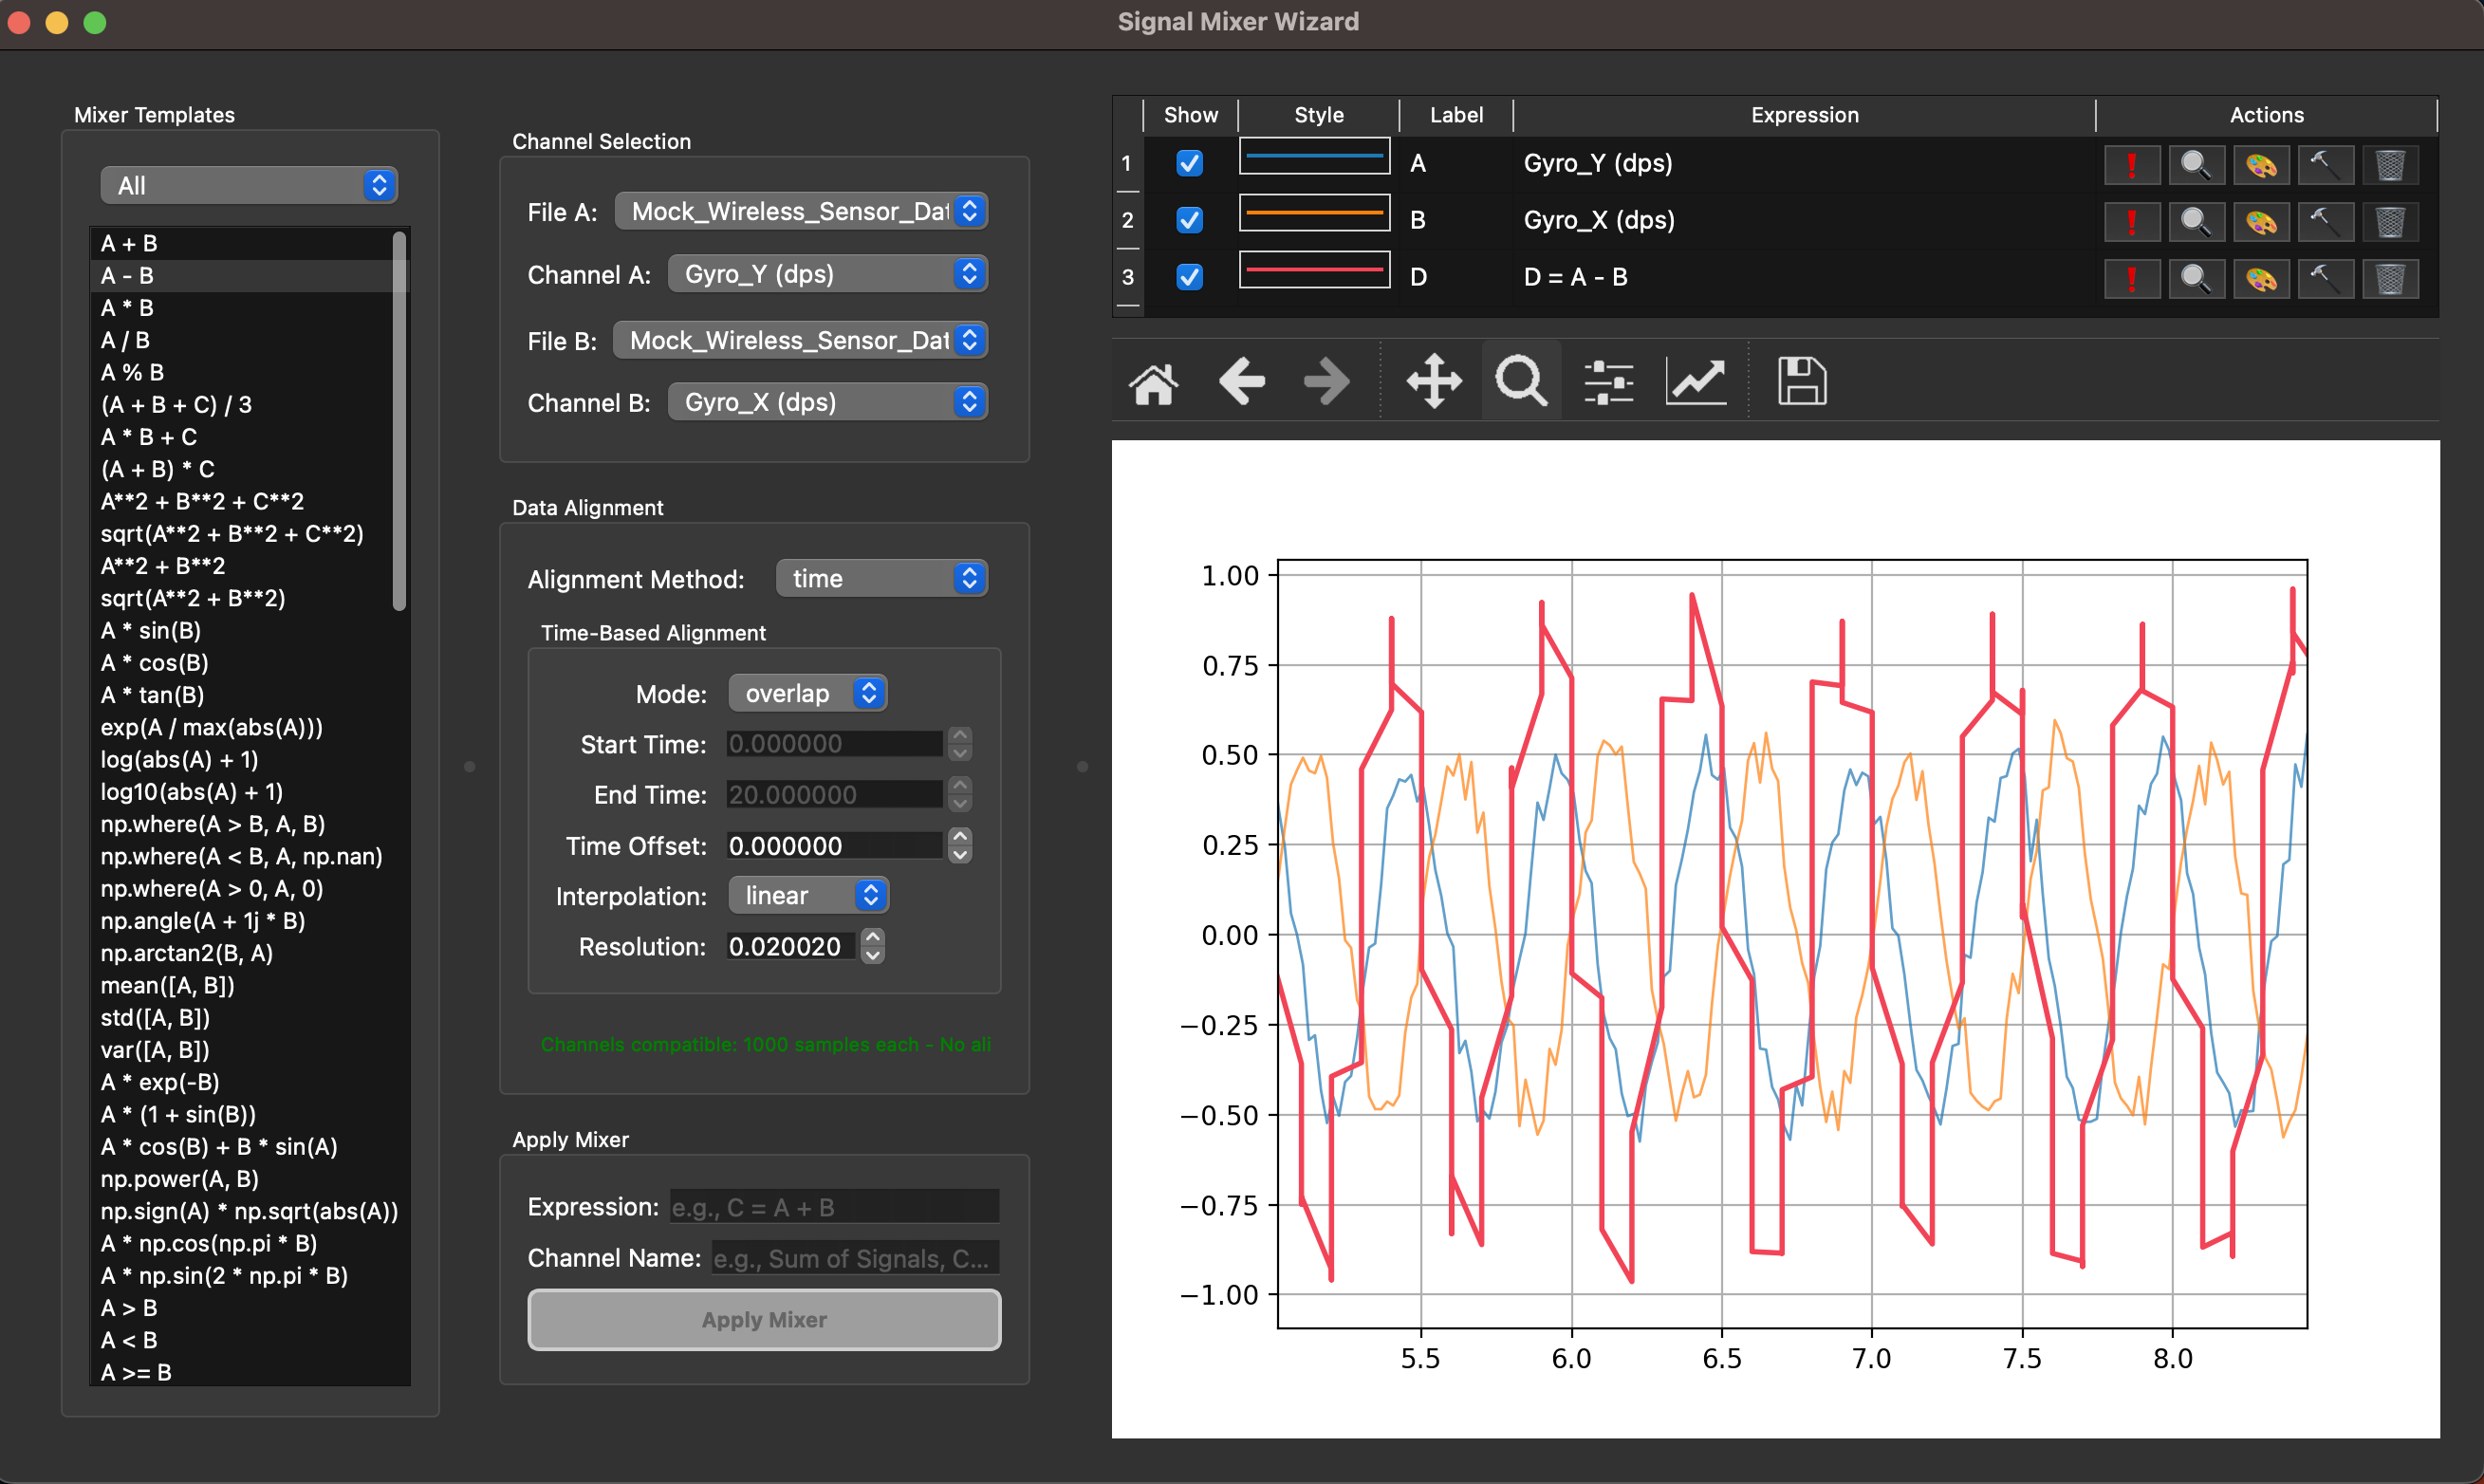
Mix Wizard: Mix two signals using templates or custom expressions.
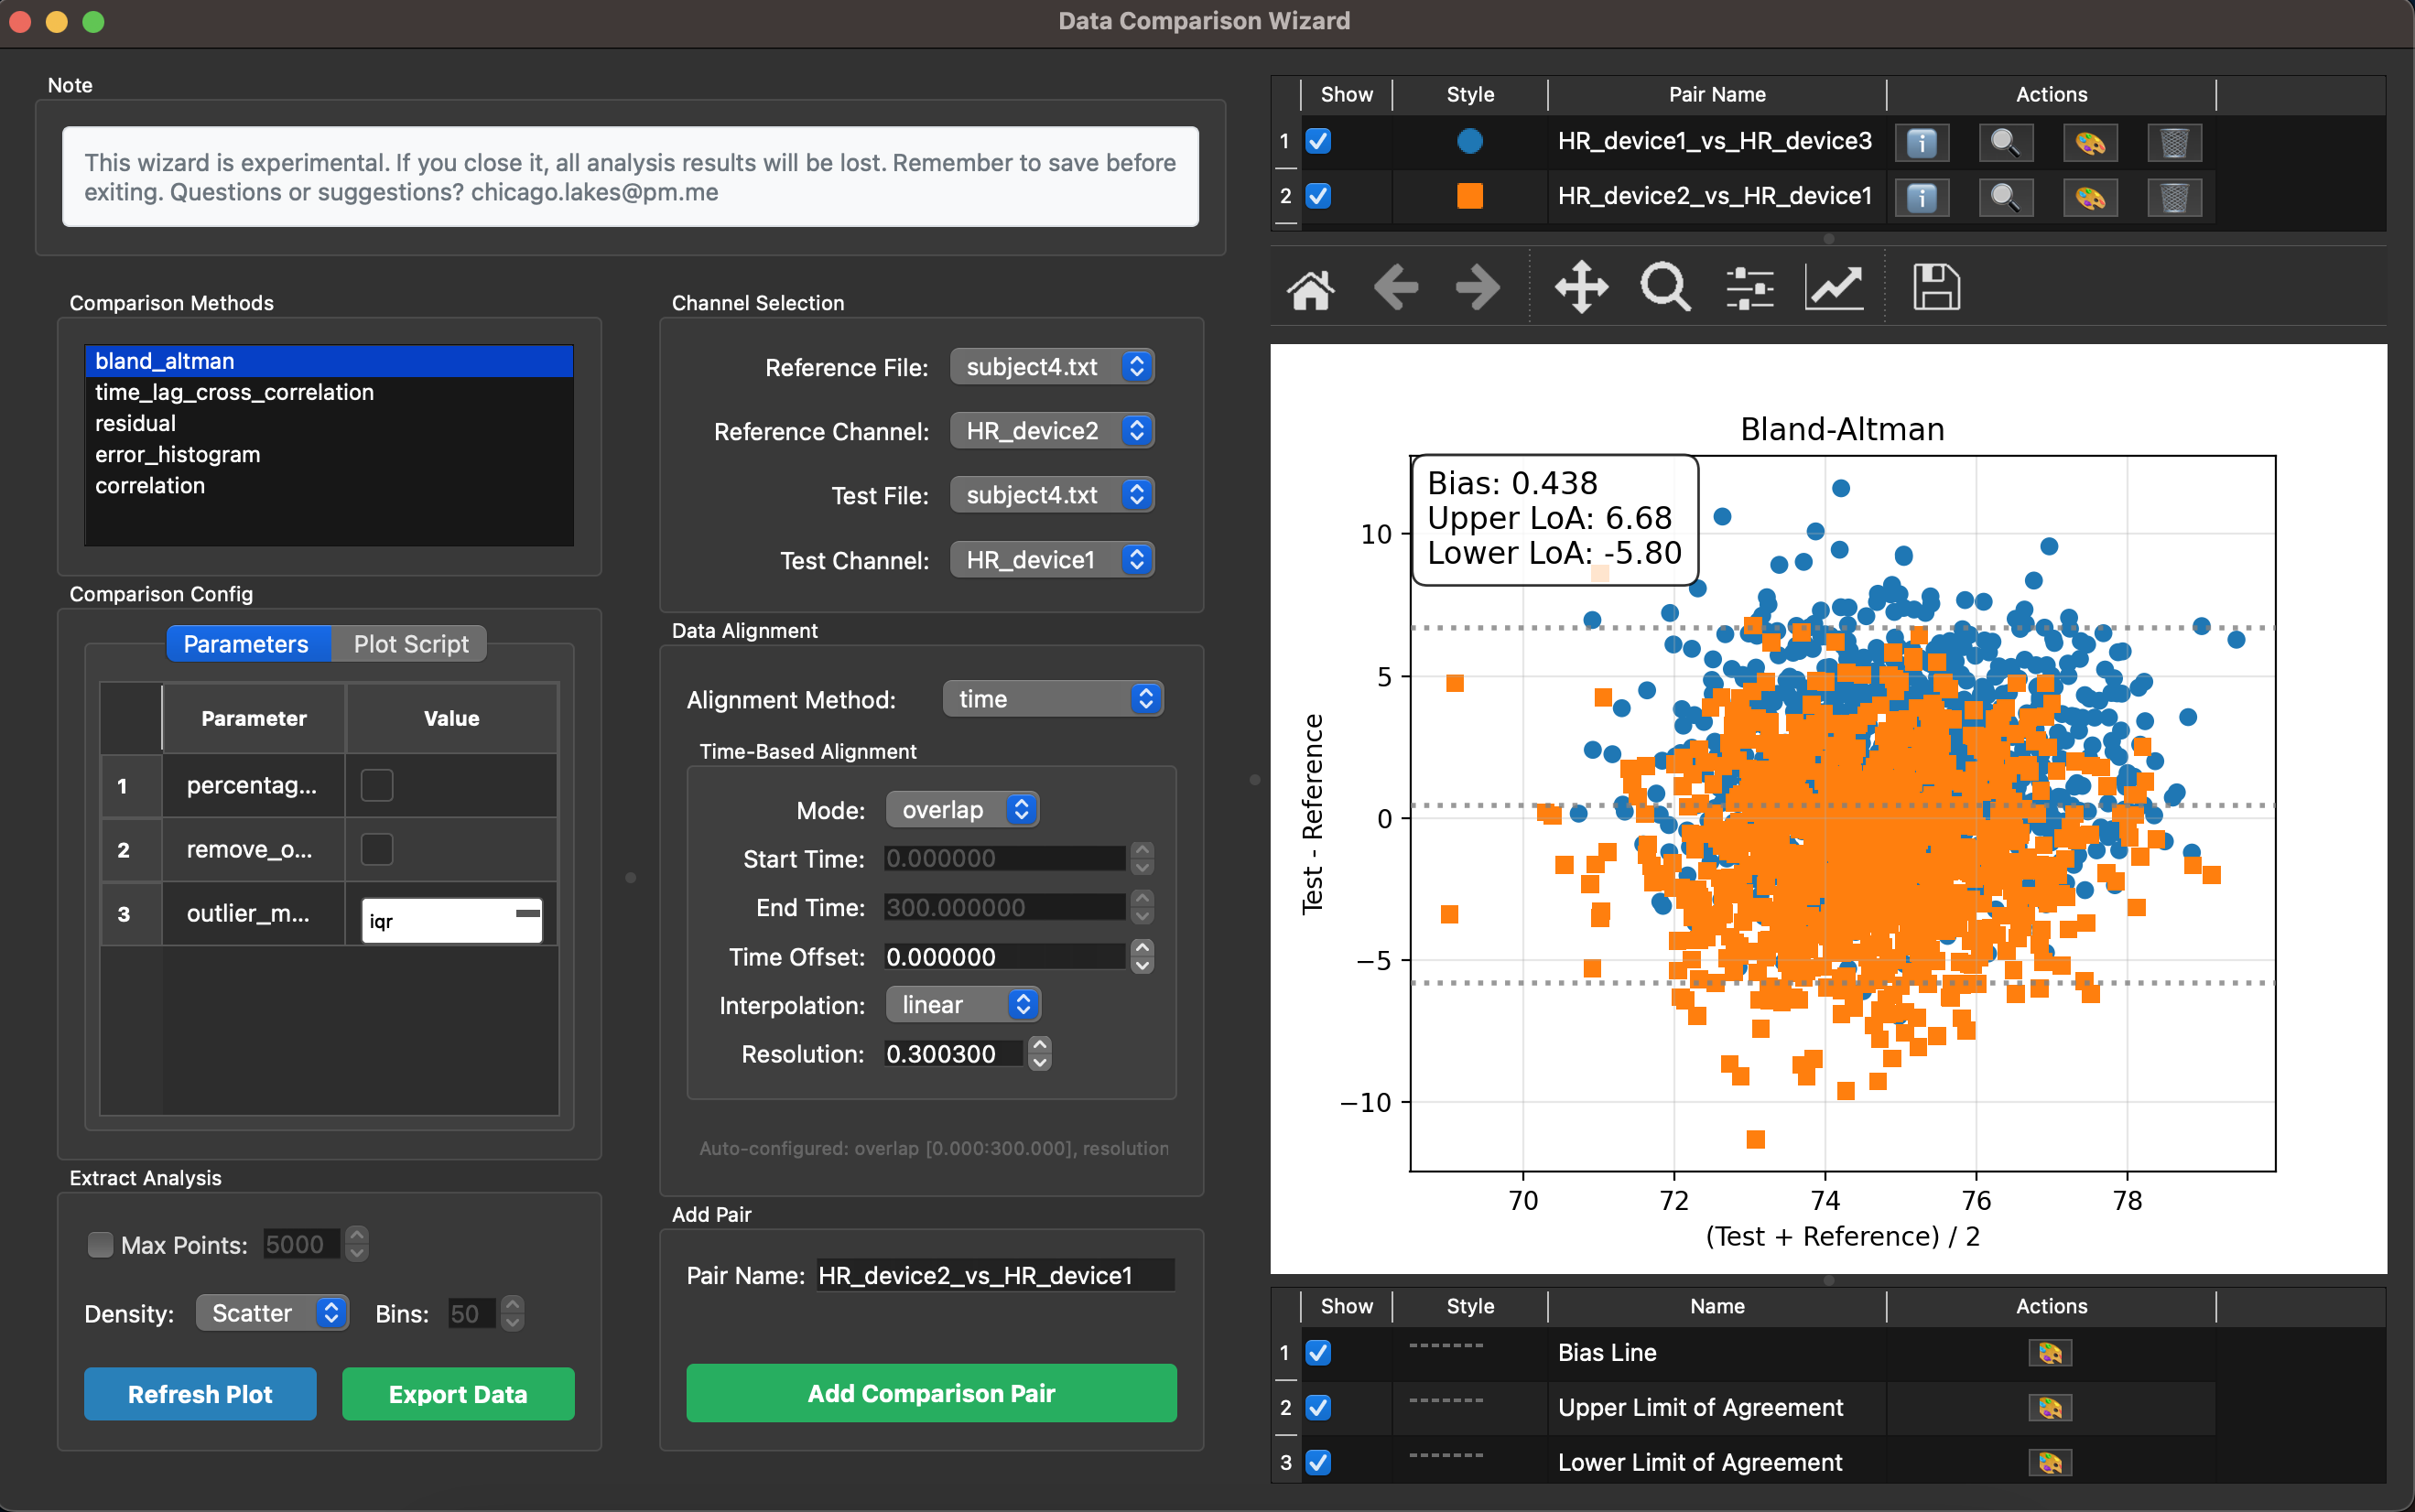
Compare Wizard: Visualize agreement between channels using Bland-Altman, correlation, or error histograms.
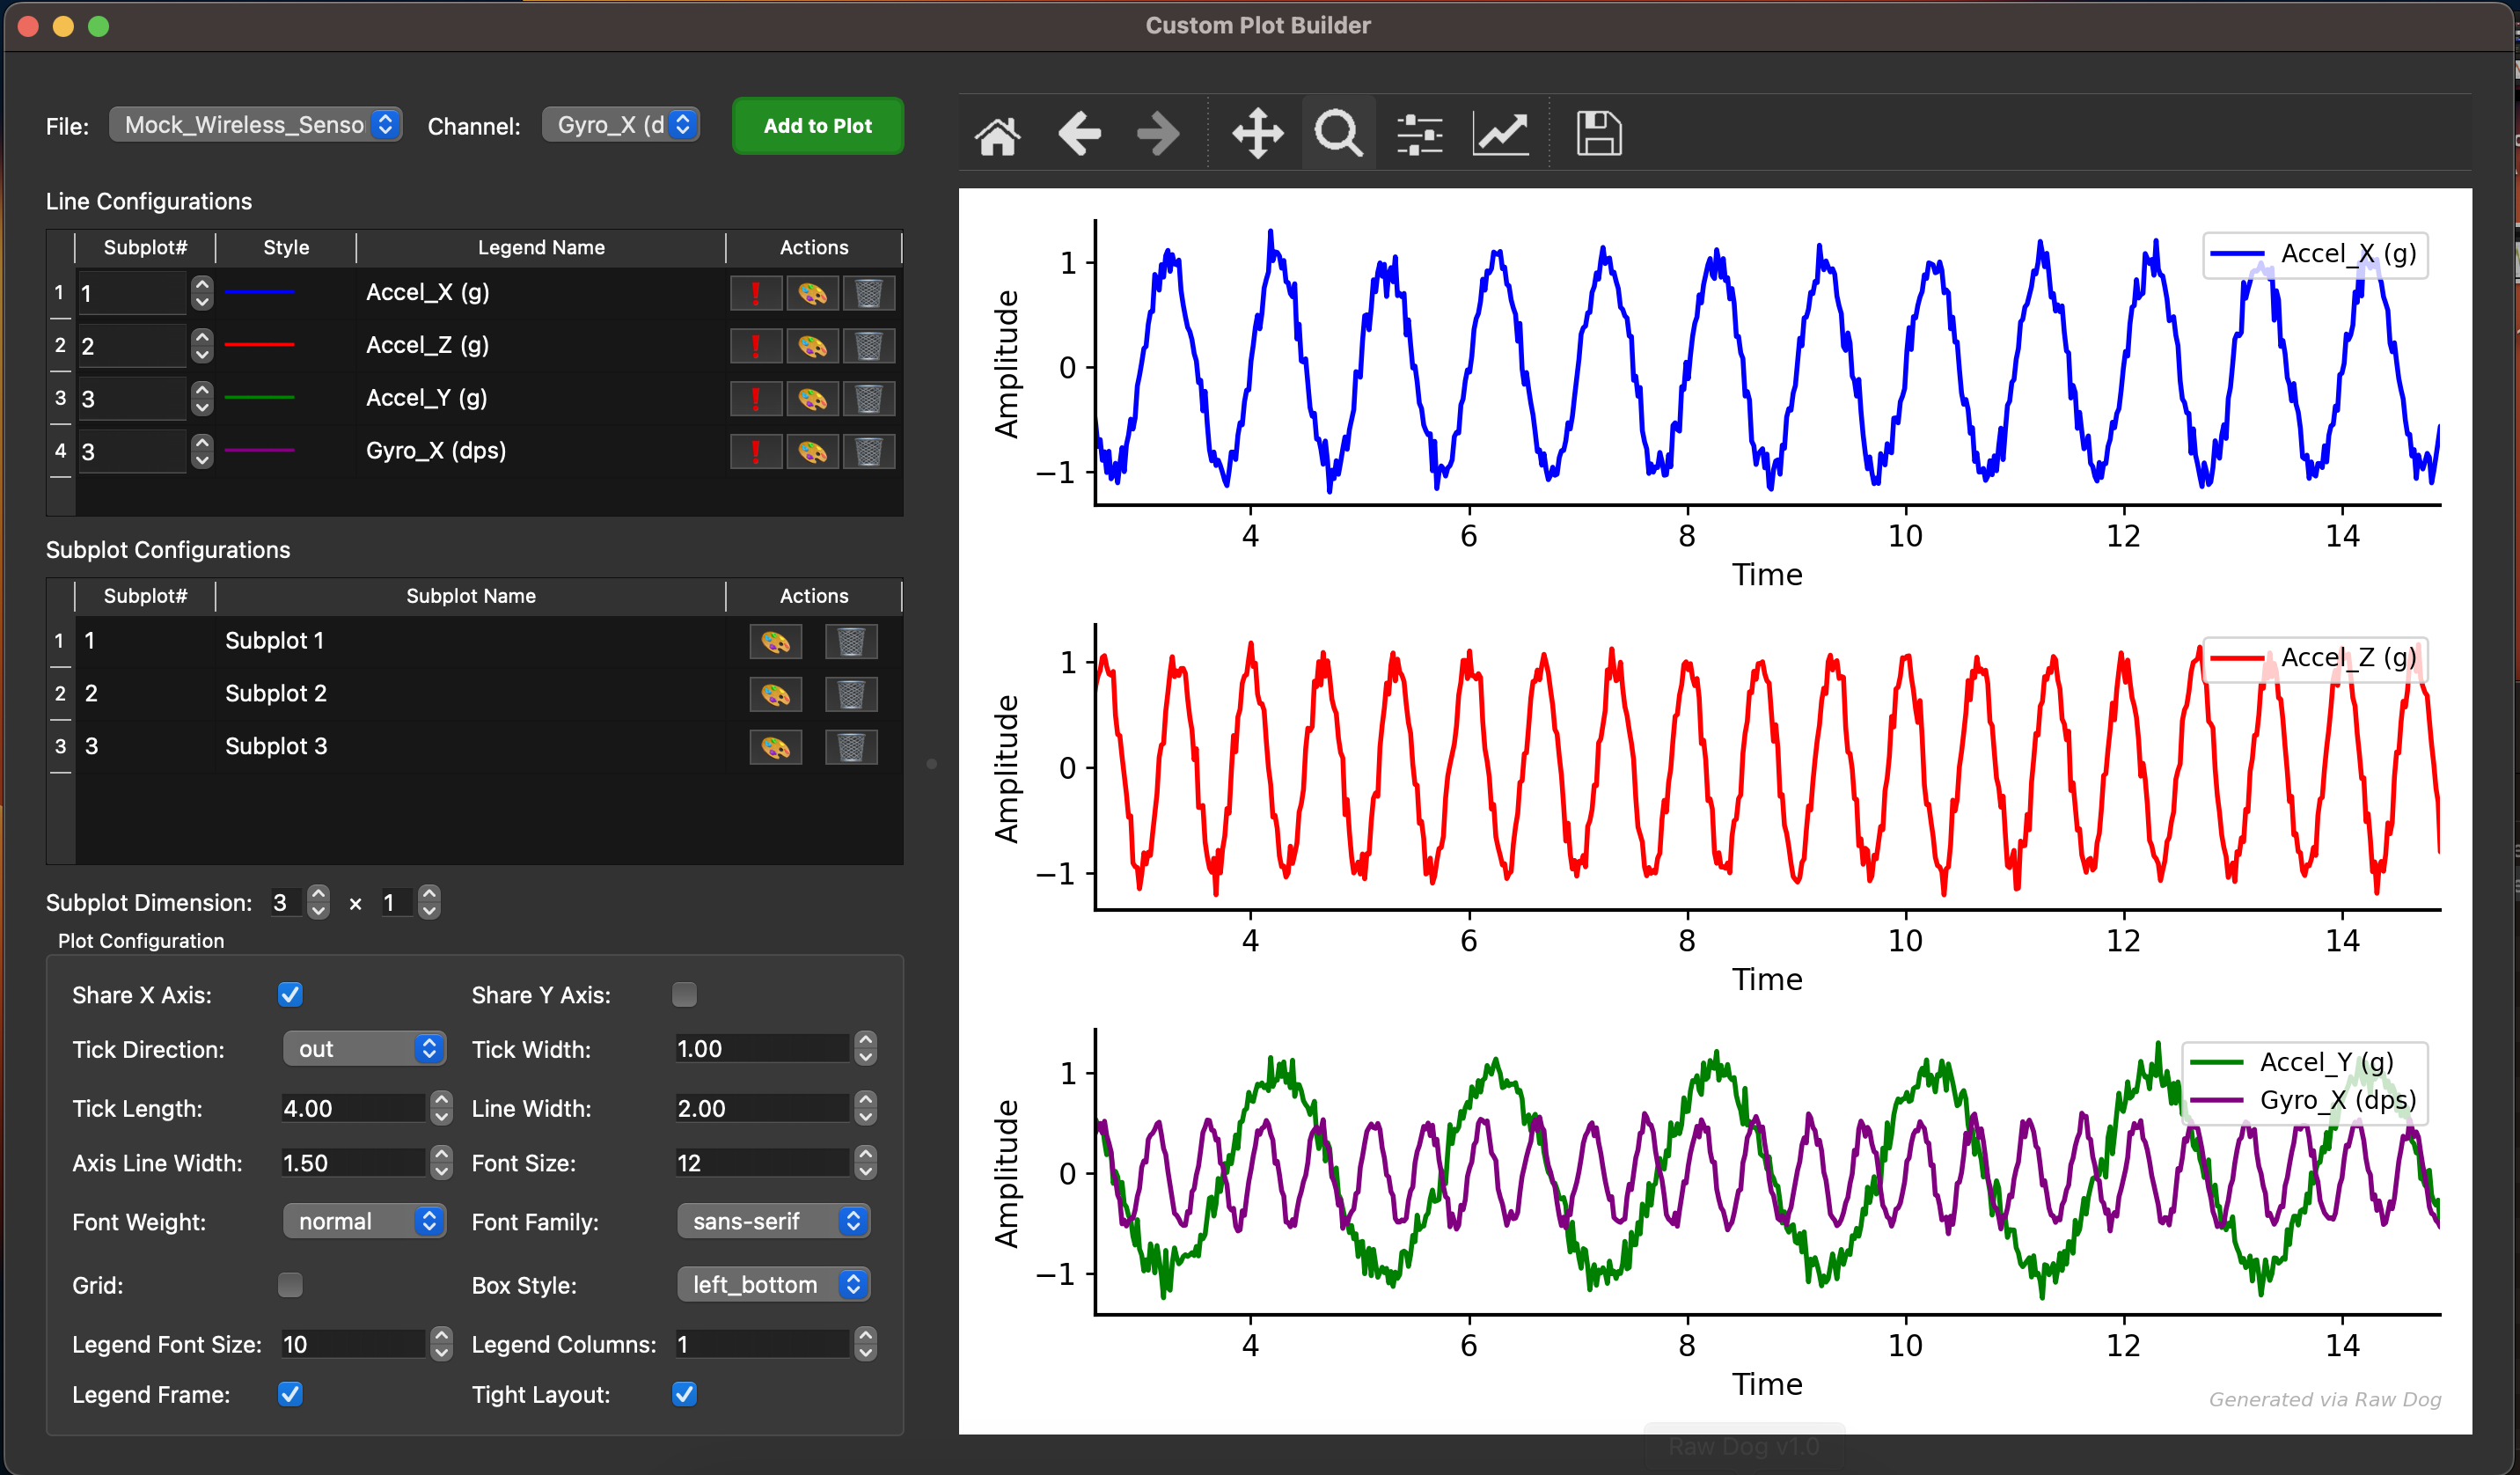
Plot Wizard: Build multi-subplot figures with stylized plots and full layout control.
This is a beta release. I'm actively working to improve stability. It's free to use . Have questions or need a custom GUI for your lab or project? Email: chicago.lakes@pm.me
Choose the version for your system:
⬇ macOS (Intel) ⬇ macOS (Apple Silicon) ⬇ WindowsSample Data:
Test Data (.txt)Follow these steps to get started — no coding required.
.zip file for your system (see buttons above)..zip file and select "Extract All..." to extract itGUI8GUI8.exe (Type = Application) to launch the tool.zip file to extract itRawDog.app to launch the toolNote: do not skip step 2 ("double-click"), else you will get a different error message
Compatibility Notes:
RawDog is a free, no-signup beta tool for signal processing and visualization. All data is processed locally on your device; we do not collect, store, or share any personal information or uploaded files. The software is provided "as is," without warranties, and use is at your own risk.